

Last month, my neighbor Dave traded his 2019 F-150 for a shiny new Tesla Model Y. He was thrilled about the environmental benefits, the tech features, and those instant-torque launches from red lights. Then his insurance renewal came in.
“Four grand a year? Are you kidding me?” Dave called me up, genuinely confused. “My truck was half that, and it’s worth almost the same!”
Welcome to the crazy world of Tesla insurance Ontario, where cars that seem smart and efficient, like your Model Y, can come with surprisingly high premiums.
Numbers That Don’t Make Sense (Until They Do)
Here’s what really happened when Dave switched vehicles:
His F-150 SuperCrew (2019): $2,200/year
His Tesla Model Y (2024): $4,100/year
Same driver, same address, same clean record. So what gives?
After spending way too much time digging into this (and talking to more insurance agents than any normal person should), I’ve figured out exactly why Dave’s wallet took such a hit.
New car models vary widely in insurance costs. In Ontario, factors like vehicle type, value, repair costs, theft rates, and the driver’s profile (age, gender, experience, driving record) all play significant roles in determining car premiums.
Check if your car and model are eligible for cheap insurance premiums using this tool!
Generally, smaller cars and high-performance or high-value models tend to carry higher insurance premiums, while larger family vehicles (SUVs, minivans, pickups) often cost less to insure due to better safety profiles and more cautious driver demographics.
If Dave had compared quotes across multiple insurers, anonymously, using a site like Beat My Insurance, he could have spotted big differences in pricing. Many drivers are surprised to find how much rates vary for the same vehicle and record.
Below, we identify ten popular 2024 models and their estimated annual insurance premiums, focusing on drivers aged 26–50 with varying experience (from 2 to 20 years). These estimates assume a typical driver (e.g., mid-30s, clean record, urban Ontario location) for comparison purposes. Actual quotes will vary with individual circumstances.
Reason Tesla Insurance Ontario Hurts
Most people assume Tesla insurance is high because of the sticker price. The real culprit is what happens when things go wrong.
The Repair Nightmare Remember when a minor collision meant a trip to any body shop down the street? Those days are over with Tesla. The “minor” damage often requires recalibrating camera systems, replacing sensors, and specialized paint processes. Only limited shops are certified to do Tesla repairs in the GTA.
The Battery Factor Every Tesla owner knows about the battery, but most don’t realize what it means for insurance until it’s too late. Battery pack damage can result in extremely expensive repairs on vehicles, sometimes approaching significant portions of the vehicle’s value.
Top 10 Models and Estimated Annual Insurance Premiums
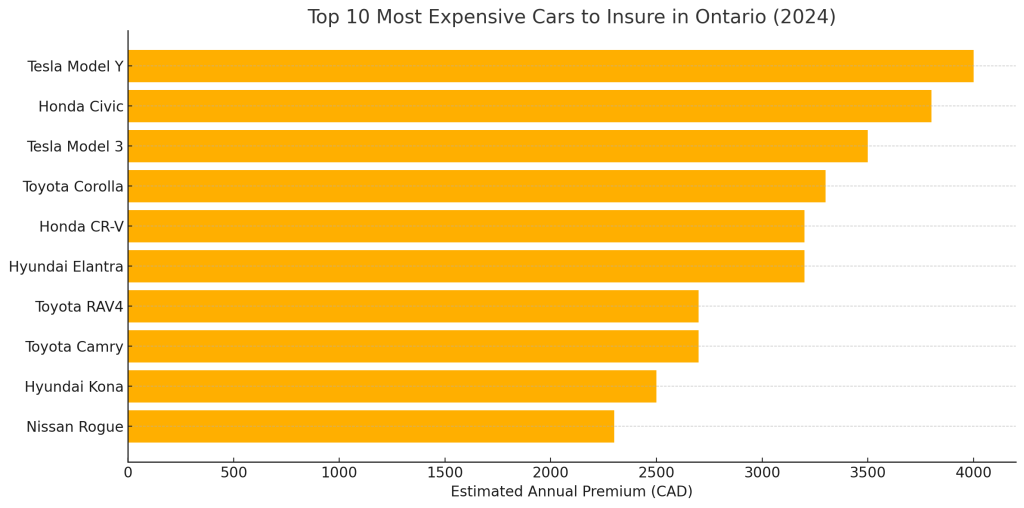
The table below lists ten widely sold 2024 car models in Ontario with some of the highest insurance premiums in their class. For each, we include an average annual premium estimate and key factors driving those costs. (All premiums are in Canadian dollars per year for a comparable driver profile, as noted above.)
| Car Model (2024) | Estimated Annual Premium | Key Factors Driving High Insurance Cost |
| Tesla Model Y (EV SUV) | ~$4,000 | Expensive EV with advanced tech – high repair/replacement costs; higher vehicle value; newer EVs have pricier claims. |
| Honda Civic (compact car) | ~$3,800 | Very popular compact car – high theft frequency and collision claim rates; often driven by younger drivers (higher risk) |
| Tesla Model 3 (EV sedan) | ~$3,500 | Entry-luxury EV sedan – high cost of parts and repairs; tech-heavy features and strong acceleration contribute to higher risk profile. |
| Toyota Corolla (compact car) | ~$3,300 | Best-selling compact – moderate theft risk and collision costs; smaller size can mean more injury claims (raising Accident Benefits costs). |
| Honda CR-V (compact SUV) | ~$3,200 | Top-selling SUV – very high theft rate in Ontario, which drives up comprehensive premiums; repair costs for SUVs; popular family vehicle (safer driver profile helps somewhat). |
| Hyundai Elantra (compact car) | ~$3,200 | Common compact sedan – similar risk profile to Corolla (small car); driven by many young or urban drivers; parts are moderately priced but claim frequency keeps rates high. |
| Toyota RAV4 (compact SUV) | ~$2,700 | Extremely popular SUV – frequently targeted by thieves in recent years (increasing comprehensive claims); otherwise a family-oriented model with good safety (mitigates some costs). |
| Toyota Camry (midsize car) | ~$2,700 (typical) | Midsize sedan – higher base price and repair costs than compacts; often owned by older, experienced drivers which lowers risk (partially offsetting the vehicle’s cost). Younger drivers in a Camry can still see very high premiums (e.g. ~$3,400/yr). |
| Hyundai Kona (subcompact SUV) | ~$2,500 (typical) | Small crossover – lower power and value, but being a lighter vehicle can lead to more damage/injury in crashes (keeping premiums from being as low as larger SUVs); generally mid-range insurance cost among top models. |
| Nissan Rogue (compact SUV) | ~$2,300 (typical) | Compact SUV – moderate insurance cost relative to above models; good safety features and a family vehicle image help. (Notably, Nissan as a brand tends to have high insurance averages – the Altima, for example, ranks poorly in claims statistics.) |
Sources: Premium estimates are based on Ontario market data and quote comparisons from rates.ca. Key factors are derived from insurance industry analysis and loss statistics, mainly from thinkinsure.com.
Why Civics Are Still Targeted: The 2019 Honda Civic, with a theft rate of 0.24%, is often stolen for parts like engines and wheels, which are in high demand. It’s not just the whole car – thieves want specific components.
The Theft Evolution: Some cars that are more in demand and offer a higher resale value are more prone to be stolen. This includes cars such as the Honda CR-V, the Honda Civic, Toyota RAV-4. These cars are not only sold in greater numbers, so there are more of them on the road, but also are in high demand.
The Demographics Game: Walk through any college campus parking lot. Count the Civics. Now count the pickup trucks.
Insurance companies have decades of data showing young drivers gravitate toward certain vehicles. The Civic, Corolla, and similar models are often starter cars. Pickup trucks? Those typically belong to established contractors and suburban families.
The Modification Culture: Civic owners often modify their vehicles with aftermarket exhausts, lowered suspensions, and performance upgrades. Insurance companies see this culture and price accordingly.
Meanwhile, pickup truck modifications tend toward practical additions: toolboxes, hitches, running boards. Less likely to encourage aggressive driving.
The Age Tax: When Experience Finally Pays Off
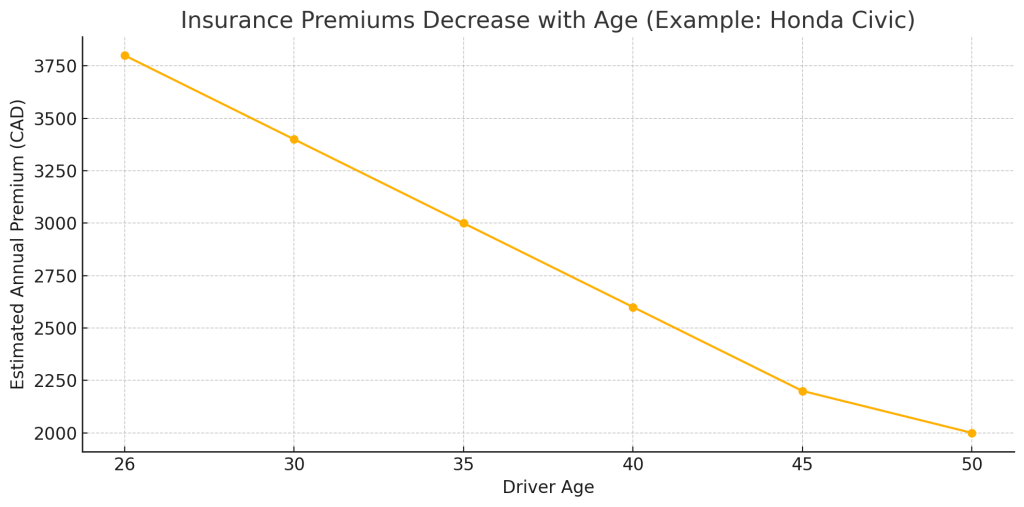
For these models, insurance rates drop significantly as drivers age and gain experience. A driver in their late 20s (with, say, ~5 years of driving experience) will often pay double or more what a 45-year-old with 20+ years of experience would pay for the same vehicle.
For example, quotes for a Honda Civic ranged from about $1,200/year for an experienced 61-year-old driver to over $6,000/year for a high-risk driver in their 20s. This reflects the steep surcharges applied to younger, less experienced drivers and those with tickets or at-fault accidents.
Gender also plays a role, especially at younger ages. In one analysis, a 22-year-old male paid ~$3,730/year for a basic Honda Civic, whereas a 43-year-old male with a minor conviction paid only $1,596 for the same car.
Young male drivers generally face higher premiums than young female drivers due to higher accident statistics, but this gap narrows with age. By around 30, men and women pay about the same rates given similar records.
In the 26–50 age range, assuming a clean record, the gender impact is smaller; both male and female drivers see their rates decrease steadily with more experience and age, especially after age 30.
Driving history is crucial. Even within the 26–50 group, a driver with just 2–3 years of experience or a recent at-fault accident will pay much more. For instance, a 35-year-old with a prior claim might see their premium double for the same vehicle compared to having no claims.
On the other hand, a 50-year-old who only got their license at 45 (5 years of experience) will still be rated higher than a 50-year-old licensed since age 16. In short, insurers heavily reward a long, clean driving record. Age by itself lowers risk, but it’s the combination of age and continuous driving experience that yields the best rates.
The Sweet Spot Insurance rates typically drop dramatically at these milestones:
- Age 25: First major decrease (about 20%)
- Age 35: Another drop (15-20%)
- Age 45: Lowest rates for most drivers
But here’s what most people miss: it’s not automatic. You need continuous coverage and a clean record to see these benefits.
What Insurance Companies Actually Look At
Vehicle Type
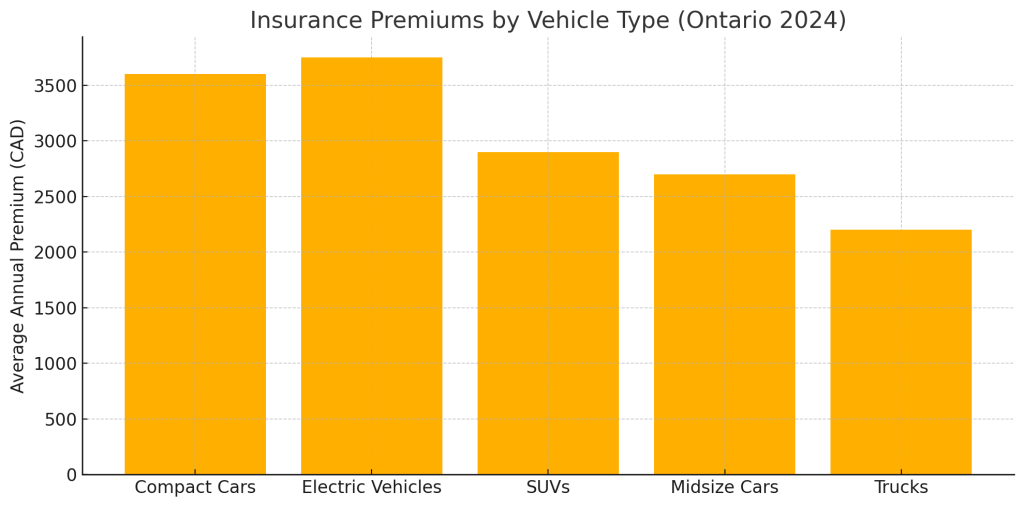
Among top-selling models, cars (especially small/compact cars) tend to have higher average premiums than larger vehicles.
In a 2023 comparison, compact cars like the Civic, Corolla, and Elantra had the highest average premiums, whereas pickup trucks (e.g., F-150, Ram 1500) had the lowest. This is partly because larger vehicles offer better crash protection and are often driven by more cautious drivers, leading some insurers to give SUVs and trucks lower rates.
Our list reflects this: notice that no full-size pickup trucks appear among the “highest premium” models – in fact, Ontario pickups often cost 18–41% less to insure on average than equivalent cars.
Theft and Claims Frequency
High-theft models command higher premiums. Several of the costliest-to-insure models (Honda Civic, CR-V, Toyota RAV4, etc.) have been frequent targets for theft or have high claims frequency, driving up comprehensive and collision costs.
The Real Numbers:
- Toyota Highlander: After two years with the Honda CR-V as the most stolen vehicle in Canada, the Toyota Highlander takes the spotlight with over 3,400 thefts.
- Honda CR-V: The Honda CR-V tops the list with 654 thefts, making it the most stolen vehicle in 2021. With a theft frequency of 9.86%.
- Honda Civic: Still high on the list for parts theft
The Theft Explosion: Thefts in Ontario shot up 48.2%, while thefts in Quebec shot up 57.9% between 2021 and 2023. Tesla Car Insurance – Humberview Insurance. This massive increase explains why your insurance jumped so much.
The New King of Theft: After two consecutive years, the Toyota Highlander has overtaken the Honda CR-V as Canada’s most stolen vehicle. This shift happened in 2024, making the Highlander a new insurance risk.
The Theft Rate Reality: Although the Honda CR-V is the most stolen vehicle in Ontario by sheer numbers, the rate at which it is stolen is considerably lower than that of a Range Rover or Gladiator. A Land Rover Range Rover is nearly 5 times as likely to have been stolen as a Honda CRV.
Technology and Repair Costs
Newer vehicles with advanced technology or expensive parts (e.g., Tesla’s electric models) tend to have high premiums. The Tesla Model Y and Model 3 were noted as the most expensive to insure among popular 2023–24 models. Their higher purchase price and costly repairs (especially for battery or sensor damage) outweigh any savings from strong safety features.
Luxury trims or sports variants of mainstream cars also see surcharges; for instance, a performance model Honda Civic Type R or a Ford Mustang GT would cost more to insure than their base-model counterparts, especially for younger drivers.
Driver Profile Impact
Within the 26–50 age range, experience and record can overshadow age. An experienced 28-year-old with a clean record may pay less than a 40-year-old with multiple traffic tickets. Insurance companies evaluate a combination of factors (years licensed, claims history, convictions, marital status, location, annual mileage, etc.) in addition to age and gender.
As a result, maintaining a clean driving record over time is the surest way to lower rates across all these popular models. Many insurers offer safe-driving discounts that accumulate after 3, 5, or 10 claim-free years.
The Low-Mileage Secret: CAA MyPace™ is an insurance program that provides the best way to pay for, reduce, and manage your auto premiums if you drive less than 9,000 kilometres per year. For work-from-home drivers, this can save 20-30% annually.
The Monitoring Reality: The new program is helping modernize insurance in Ontario by giving motorists the power to monitor how much they drive and pay for auto insurance based on that mileage. You literally pay per kilometer driven.
The Telematics Trade-off: With CAA Connect, you can get discounts for adopting safe driving habits. You can save up to 15% on your auto insurance premiums after 1 year. But the CAA MyPace payment program is currently designed to offer savings for low-mileage drivers and cannot be combined with our CAA Connect® telematics program.
Why Pickup Trucks Are Insurance Bargains”
The Responsibility Factor Pickup owners tend to:
- Be older on average
- Have established careers
- Use their vehicle for work (encouraging more careful driving)
- Live in suburban or rural areas (lower accident rates)
The Safety Advantage Sitting higher gives pickup drivers better visibility and reaction time. In multi-vehicle accidents, pickup occupants are statistically less likely to be injured.
The Mileage-Based Insurance Revolution
The Game Changer: CAA MyPace is for low-mileage drivers, with a cap of 12,000 km driven annually. If you drive less than 12,000 km/year, you’re potentially overpaying with traditional insurance.
How It Actually Works: The way it works: we charge a non-driving based premium upfront based on traditional variables, and we add on 1,000 kilometers worth of driving premium to start. Once this distance is exhausted, we add on another 1,000 kilometers, and so on.
Location Matters More Than You Think
Living in Toronto proper adds roughly 40% to your insurance premium compared to surrounding areas. The combination of higher theft rates, more accidents, and expensive repairs creates a perfect storm.
The Rural Advantage Rural drivers often pay significantly less for the same vehicle compared to urban drivers. Lower crime, fewer accidents, and cheaper repairs make all the difference.
The Marriage Discount (It’s Real) Married drivers typically receive about a 15% discount. Insurance companies have data showing married drivers have fewer accidents and make fewer claims. It’s actuarial science based on decades of claims data.
Money-Saving Tips
- The Deductible Strategy: Raising your deductible from $500 to $1,500 can save hundreds annually for careful drivers.
- The Garage Discount: Parking in a garage can save 10-20% on your premium.
- The Bundle Consideration: Don’t automatically bundle home and auto – sometimes separate policies offer better rates.
- The Annual Review: Review your insurance annually, not just at renewal. Shop around regularly for better rates.
- Time Saving: Beat My Insurance lets you compare Ontario car insurance quotes in one place without sharing your contact details. Stay anonymous without having to call multiple brokers, and the best part is you can share your insurance post with just one click!

The highest insurance premiums among new vehicles in Ontario are seen on popular compact cars and tech-heavy models, notably the Honda Civic and Tesla EVs, often exceeding $3,000–$4,000 per year on average. In contrast, larger SUVs and trucks, despite being top sellers, generally incur lower premiums (sometimes under $2,500) due to safer designs and driver profiles.
For drivers between 26 and 50, getting older and accumulating experience steadily reduces the cost for any given model. A cautious 45-year-old might pay half of what a 26-year-old pays for the same car, all else equal. Thus, while vehicle choice determines the base premium, the driver’s age, experience, and record remain critical in how high (or low) that premium will ultimately be.
Sources: Ontario insurance industry reports and brokers’ data were used for the above comparisons. These include quote simulations for different driver profiles and loss statistics from the Insurance Bureau of Canada. All figures are approximate and can vary by insurer and individual circumstances. Always compare quotes for your specific situation, as rates can differ by 50% or more even for the same driver/vehicle combination in Ontario’s competitive market.